Difference between revisions of "File:Ibara Bomb Stock Chart.png"
Jump to navigation
Jump to search
(Composite image showing Bomb Stock at different levels in Ibara. A = no bombs or fragments. B = No bombs, one fragment. C = No bombs, 24 fragments. D = 2 bombs, 24 fragments. E = 4 bombs, 40 fragments. Original images captured in MAME 0.221B at native resolution, then upscaled to 400% using Nearest Neighbor interpolation. Adjustments and graphics made in Adobe Photoshop and Illustrator.) |
(No difference)
|
Revision as of 18:37, 13 August 2020
Summary
Composite image showing Bomb Stock at different levels in Ibara.
A = no bombs or fragments. B = No bombs, one fragment. C = No bombs, 24 fragments. D = 2 bombs, 24 fragments. E = 4 bombs, 40 fragments.
Original images captured in MAME 0.221B at native resolution, then upscaled to 400% using Nearest Neighbor interpolation. Adjustments and graphics made in Adobe Photoshop and Illustrator.
File history
Click on a date/time to view the file as it appeared at that time.
| Date/Time | Thumbnail | Dimensions | User | Comment | |
|---|---|---|---|---|---|
| current | 18:37, 13 August 2020 | 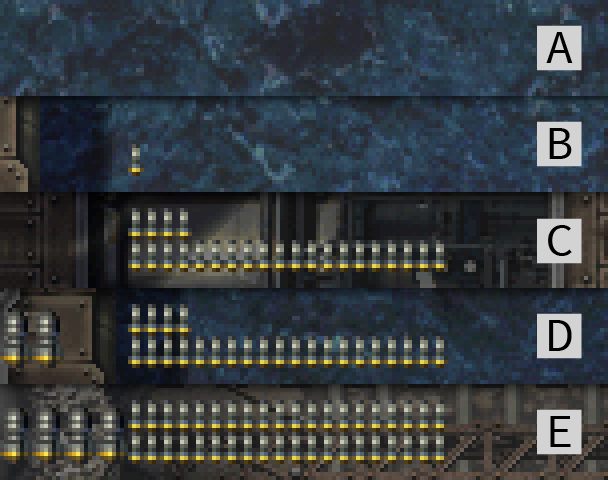 | 608 × 480 (71 KB) | Softdrink (talk | contribs) | Composite image showing Bomb Stock at different levels in Ibara. A = no bombs or fragments. B = No bombs, one fragment. C = No bombs, 24 fragments. D = 2 bombs, 24 fragments. E = 4 bombs, 40 fragments. Original images captured in MAME 0.221B at native resolution, then upscaled to 400% using Nearest Neighbor interpolation. Adjustments and graphics made in Adobe Photoshop and Illustrator. |
You cannot overwrite this file.
File usage
The following page uses this file: